Reducing Your Carbon Footprint One Step At A Time
Author: E.W. Ferreira, Furnace Design Engineer, TECO
“We have paved over, farmed over, cut down, traded and extracted, and polluted in the natural world and emitted into our atmosphere, and meanwhile, whilst our economy has grown five-fold and our trade has grown ten-fold, we need to rethink and reengineer the opportunities that lie before us”.[1]
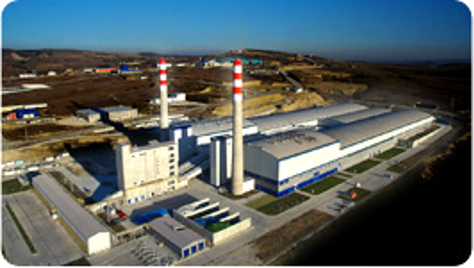
The signs of global climate change have been visible for decades. Some haven’t noticed; many see but choose to ignore it; yet, a few are paying attention and taking bold steps to tackle the negative impact of climate change. One such company is Park Cam, part of the Ciner Glass Group. In 2013 and then again in 2015 Tecoglas Ltd. designed and built the two largest end-fired container plants (Figure 1) in Turkey for Park Cam, delivering high-quality glass bottles at a very low specific energy consumption. Fast forward to 2021, amidst a global pandemic and country lockdowns, Ciner Glass announced they are expanding glass packing production activities in the United Kingdom (UK) and Europe, in addition to expanding their facility in Turkey.

These expansions had already been designed with the goal of reducing carbon emissions. The Belgium site was chosen for its proximity to one of the largest silica sand quarries in Europe, reducing transport-associated emissions. In the UK, they have plans to support the creation of a Return on Deposit System (RDS) and are already planning to act on the bill with their investments to create the circular economy cycle for glass which offers the potential to capture the lost value from the recycling of glass and to save raw materials, energy and carbon emissions.
Ciner Glass is committed to cutting more carbon emissions, by developing both short-term and long-term plans to achieve the goal of carbon-neutral production in the UK and Belgium. A big part of this is the design of the glass furnaces and the technology used in them to melt the glass.
Tecoglas (part of the TECO Group) has been selected as the technology supplier for these furnaces. Park Cam approached Tecoglas to help them understand what options were available and how to implement the best transition from current operating practice to a low-carbon footprint operating setup. This will allow Ciner Glass to align with global pledges to attain net-zero emissions by 2050. TECO is supporting this effort through technology development and a heavy emphasis on Computational Fluid Dynamics (CFD) modeling.
To start with, the end port furnace is a well-designed and technically advanced furnace, capable of delivering energy consumptions that are comparable with the best in the industry for a similar unit, whilst keeping emissions down. This is done without recourse to weir walls, deep refiners, bubblers, or oxygen enrichment, and with minimal changes to the batch formulation. This is accomplished utilizing TECO’s modern technologies wherein a minimal amount of electric boost is used for coloured glass to eliminate reducing pull.
TECO’s knowledge and expertise of the glass melting process were called upon to offer a solution to attain net-zero CO2 emissions by 2050, which was determined to be all-electric melting with the energy required provided through renewable technologies (green electricity). The technology to electrically melt glass is available now, however, there are some roadblocks such as the cost and availability of high-demand green electricity as well as glass refining issues. A solution is needed to cover the gap. There are essentially only two furnace rebuilds left to solve these issues and to get the infrastructure in place between now and 2050. The price of electricity will become competitive as this is driven by legislation. The proposed interim solution is a “conventional” furnace with provisions for enough boost to go from 0% pull from boost to 80% and to systematically increase the electric boost while simultaneously reducing the top-fired fuel as time and circumstance change. A systematic change is emphasized, as an abrupt change holds risk and loss.
An extensive CFD model study was performed by TECO’s technical department to determine the impact of using a high amount of electric boost in an End Port Furnace (EPR), which is not a simple task when trying to include 6MW of boost. The power needs to be distributed over a number of electrodes and control zones to limit excessive consumption of electrodes. This distribution also needs to be located in such a manner that glass quality is maintained. A porcupine version of the EPR was modeled that enabled a large number of boost profiles to be applied to get an understanding of the behavior of high boost in such a furnace.
The melter had 14 zones consisting of a number of electrodes per zone. The glass studied was a clear container flint composition. The control strategy was to put in 6MW of electrical boost and adjust the top-fired fuel to maintain a target throat entrance temperature. The boost represented 33% of the total energy input. The standard deviation on the fuel requirement was 1.44% of the average fuel required for all the models.
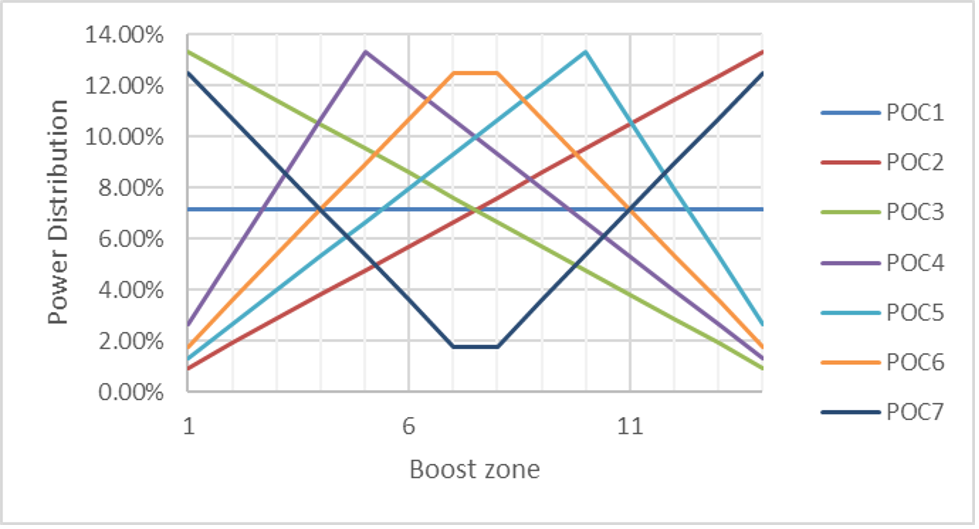
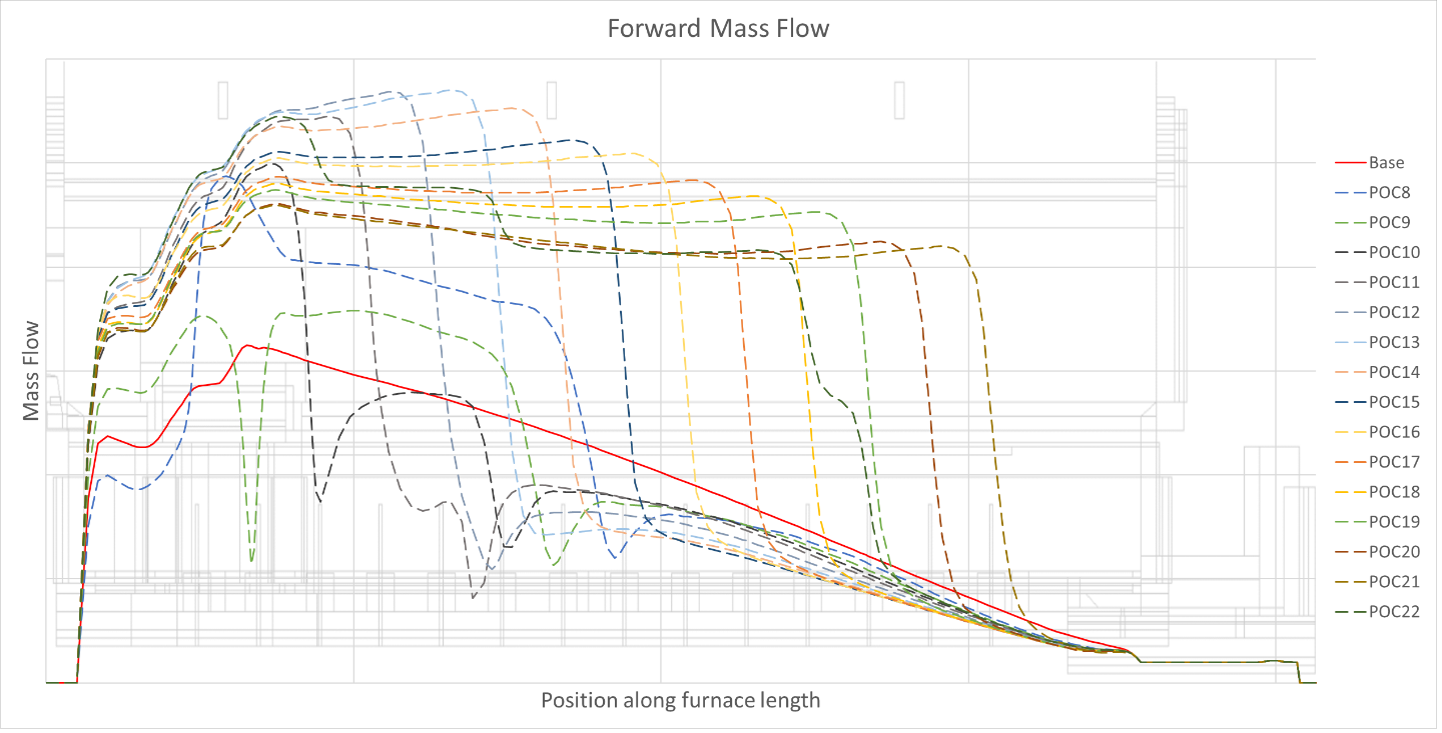
Figure 2 shows the boost profiles studied for the first 7 scenarios. In the next 14 scenarios, all the power was placed on a single zone. This is not practical in reality due to high current densities in the electrodes but does give insight as to how the convection currents are affected. The last scenario was a “typical” batch and hotspot boost zone setup. The results were revealing and confirmed some aspects that we already knew. None of the boost configurations could beat 100% top fire based on calculated glass indices.

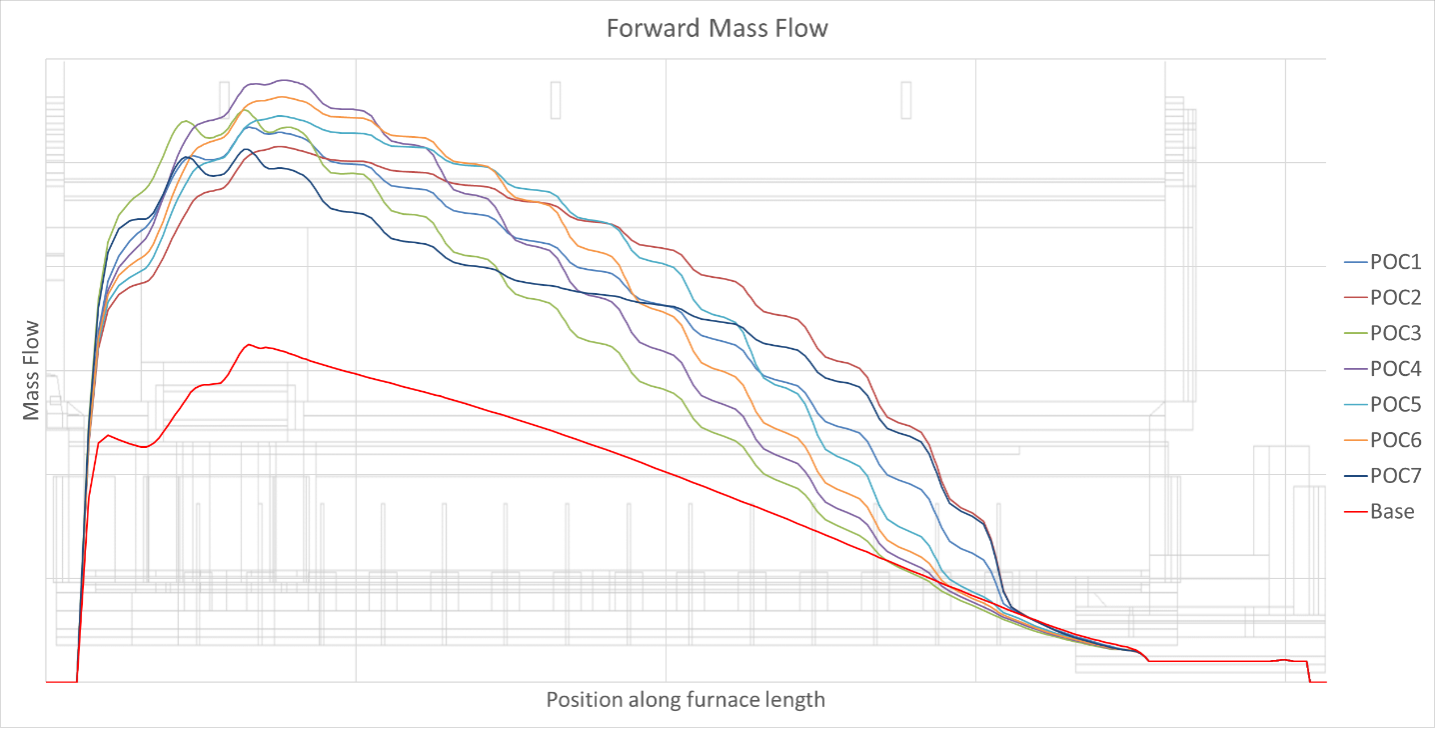
Looking at the mass flow in the tank is one useful method of explaining what is happening in each scenario (Figures 3 and 4). The mass flow is an indication of the glass flow convection currents in the tank. The first noticeable point is that the boost increases the mass flow in the tank, and there is only a single convection current; this means the residence time is less. With a constant controlled throat entrance temperature for all the scenarios, it is reasonable to assume the glass temperatures in the tank are similar. With a shorter residence time and no noticeable temperature increase, glass quality is reduced. Secondly, there is an inflection (slight increase in the forward flow) every time boost is applied to the glass.


When the boost is applied at a single zone, the mass flow profile changes. A strong convection current develops between the back wall and the boost location. Downstream, after the boost, the mass flow reduces to lower than the base scenario. This implies more residence time in the tank for fining and that is why the indices for these scenarios are better than the profiled boost scenarios.
From this study, it is clear that careful consideration must been given to the location of applied boost in a tank, especially at high power input. It is also reasonable to assume that the optimal location at a high boost will differ from a lower boost level and will be confirmed in another study. The highly boosted furnace, therefore, requires the flexibility to apply the correct amount of power at the appropriate location during this future slow transition from low boost to high boost operation whilst maintaining good quality glass.
I conclude with a quote from Edmund Burke. “Nobody made a greater mistake than he who did nothing because he could only do a little”.
[1] Inger Andersen, Executive Director of UNEP at COP26 on the topic of Strengthening NDC ambition through circular economy.


Add a Comment